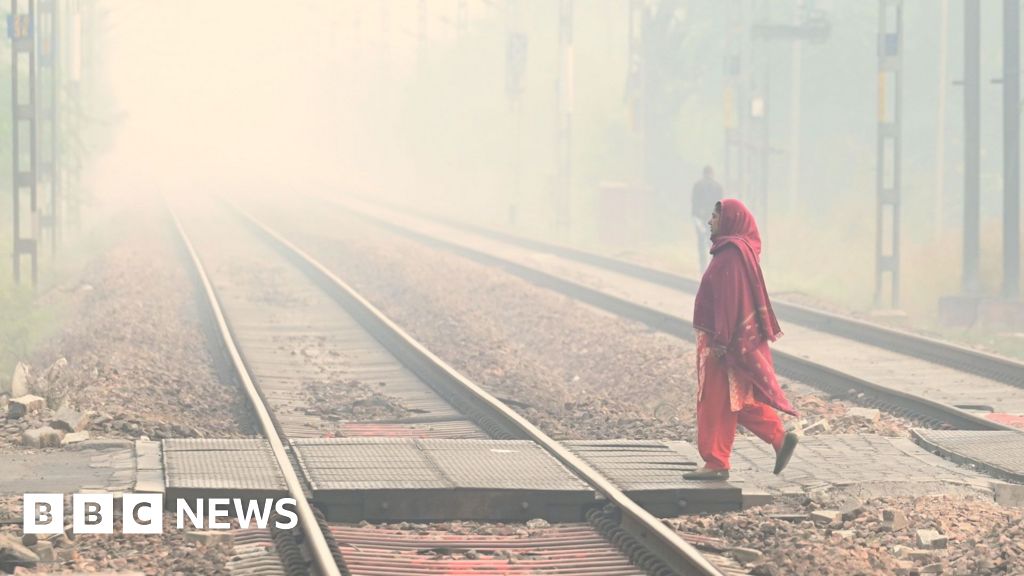
Every November, millions of people across northern India brace themselves for a familiar but distressing reality: the air turns thick with pollution, the sky takes on a hazy, ashen hue, and even stepping outdoors becomes a struggle. For many, the day begins with a routine check of the air quality index (AQI) to gauge just how hazardous the air is. However, the numbers they see can vary dramatically depending on which monitoring source they consult, leading to widespread confusion and concern.
India’s government-backed air quality monitoring apps such as SAFAR and SAMEER report AQI values that cap at 500, the maximum limit on India’s official air quality scale. This scale simplifies complex data gathered on various pollutants—such as PM2.5 and PM10 particulate matter, nitrogen dioxide, sulfur dioxide, carbon monoxide, and ozone—into a single number that reflects overall air quality. According to this scale, an AQI above 200 indicates significant breathing discomfort for most people if exposed for prolonged periods, while readings between 400 and 500 fall into the “severe” category, affecting healthy individuals and seriously impacting those with pre-existing health conditions.
Despite this severe classification, the official scale stops at 500, refusing to report higher numbers even on days when pollution levels far exceed this threshold. In contrast, private and international monitoring platforms like IQAir and open-source tools such as AQI often display values that surpass 600, sometimes even crossing 1,000. This discrepancy prompts a common question each year: which numbers should people trust? Why does India’s official reporting system not reflect the full extent of the pollution?
The root of this discrepancy lies in the design of India’s AQI system, introduced over a decade ago when the National Air Quality Index was first launched. At that time, the decision was made to cap the AQI at 500. According to Gufran Beig, founder director of SAFAR, this ceiling was set because it was assumed that once pollution hit this level, the health impact was already at its worst. “It was assumed that the health impact would be the same no matter how much higher it goes because we had already hit the worst,” he explains. The cap was also intended to prevent public panic, signaling that crossing 500 represented an alarming situation demanding urgent action.
While this approach may have seemed reasonable at the time, it has the unintended effect of flattening the data. Once pollution levels cross 500, the official monitors simply report “500” regardless of how much worse the air quality actually is. This means that the true scale of pollution is obscured from public view. “International organisations and portals don’t impose such a cap,” Beig notes, which is why global platforms display far higher AQI values than Indian government apps.
Attempts to clarify this issue by reaching out to India’s pollution control board have not yielded official responses, but experts emphasize that the cap is only part of the story. Another key difference lies in how “hazardous” air quality is defined. For example, the World Health Organization (WHO) sets a much stricter guideline for particulate matter smaller than 2.5 micrometers (PM2.5), declaring levels above 15 micrograms per cubic meter in a 24-hour period as hazardous. India’s threshold, by comparison, is set at 60 micrograms per cubic meter—four times higher. This disparity reflects differing national standards and environmental realities.
Furthermore, there is no universal formula for calculating the AQI globally. Different countries—including the United States, China, and European Union members—apply their own pollutant thresholds and indices, tailored to their specific environments, weather patterns, and public health considerations. “WHO provides guidelines and every country has built its index based on its own adaptability, weather and local environment,” Beig says. Therefore, comparing India’s AQI directly with WHO or US standards can often be misleading.
The instruments used to measure air pollution also differ, contributing to the variations in reported AQI values. In India, the pollution control board relies on Beta Attenuation Monitors (BAMs). These instruments physically measure the mass of particles suspended in the air by detecting how much beta radiation is absorbed by collected particulate matter. BAMs are calibrated to strict, standardized metrics and provide physically measured data for each reading.
By contrast, many private and international platforms depend on sensor-based monitors, which use laser scattering and electrochemical methods to estimate the number of

